Inspecting the results of processing
After running the entire pipeline, you should have all results under the output/results/ folder.
CSA for T2 data
Here for example, we show the mean CSA averaged between C2-C3 levels computed from the T2 data. Each line represents a subject.
Filename |
Slice (I->S) |
VertLevel |
MEAN(area) |
STD(area) |
|---|---|---|---|---|
sub-01_T2w_seg.nii.gz |
161:203 |
2:3 |
83.5690681039387 |
2.82182217691781 |
sub-03_T2w_seg.nii.gz |
159:199 |
2:3 |
60.6215201725797 |
2.87402688226702 |
sub-05_T2w_seg.nii.gz |
159:190 |
2:3 |
68.763579167899 |
3.19840203029727 |
The variability is mainly due to the inherent variability of CSA across subjects.
MTR in white matter
Here are the results of MTR quantification in the dorsal column of each subject between C2 and C5. Notice the remarkable inter-subject consistency.
Filename |
Slice (I->S) |
VertLevel |
Label |
Size [vox] |
MAP() |
STD() |
|---|---|---|---|---|---|---|
sub-01/anat/mtr.nii.gz |
3:16 |
2:5 |
dorsal columns |
370.15204844543 |
49.7198531140872 |
4.99870360243909 |
sub-03/anat/mtr.nii.gz |
3:15 |
2:5 |
dorsal columns |
282.686966627213 |
49.3521578793729 |
5.19981366995629 |
sub-05/anat/mtr.nii.gz |
4:13 |
2:5 |
dorsal columns |
229.620127825366 |
49.2113270517532 |
4.76773091479419 |
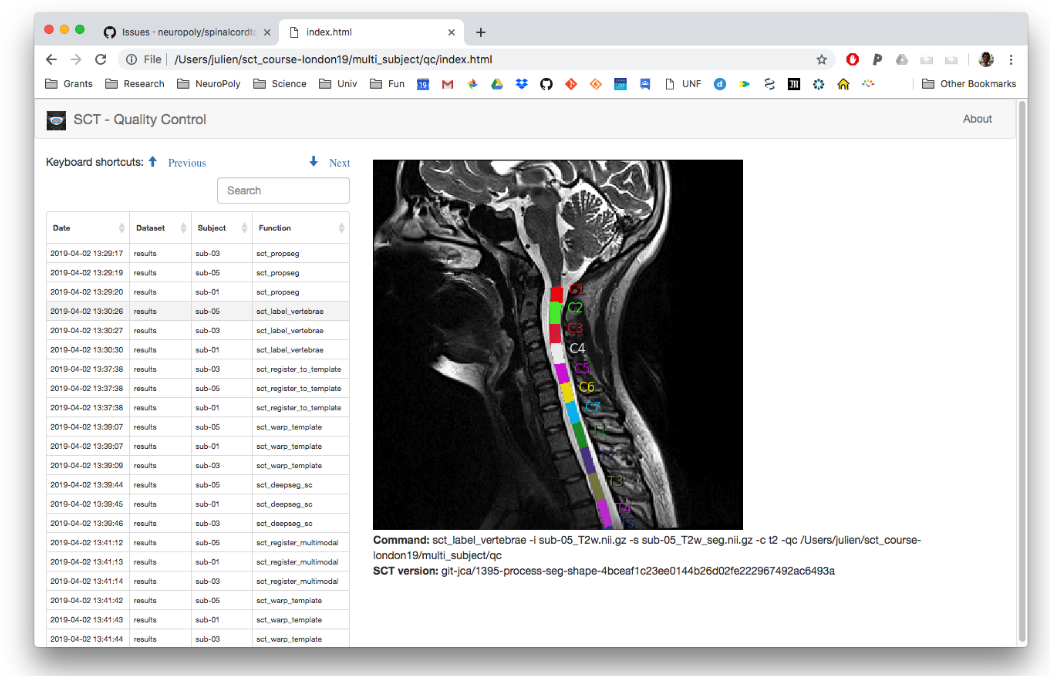
Quality Control report
A QC report is generated under qc/. As shown before, the QC report is useful to quickly assess the quality of the analysis pipeline.