sct_dmri_separate_b0_and_dwi

https://raw.githubusercontent.com/spinalcordtoolbox/doc-figures/master/command-line/sct_dmri_separate_b0_and_dwi_example.png

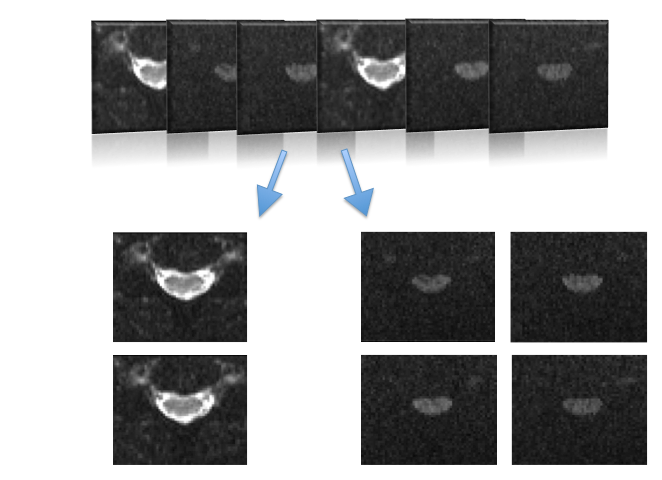
Separate b=0 and DW images from diffusion dataset. The output files will have a suffix (_b0 and _dwi) appended to the input file name.

usage: sct_dmri_separate_b0_and_dwi -i <file> -bvec <file> [-a {0,1}]
                                    [-bval <file>] [-bvalmin <float>]
                                    [-ofolder <folder>] [-h] [-v <int>]
                                    [-profile-time [<file>]]
                                    [-trace-memory [<folder>]] [-r {0,1}]

MANDATORY ARGUMENTS

-i

Diffusion data. Example: dmri.nii.gz

-bvec

Bvecs file. Example: bvecs.txt

OPTIONAL ARGUMENTS

-a

Possible choices: 0, 1

Average b=0 and DWI data. 0 = no, 1 = yes

Default: 1

-bval

bvals file. Used to identify low b-values (in case different from 0). Example: bvals.txt

Default: “”

-bvalmin

B-value threshold (in s/mm2) below which data is considered as b=0. Example: 50.0

-ofolder

Output folder.

Default: “.”

MISC ARGUMENTS

-v

Possible choices: 0, 1, 2

Verbosity. 0: Display only errors/warnings, 1: Errors/warnings + info messages, 2: Debug mode.

Default: 1

-profile-time

Enables time-based profiling of the program, dumping the results to the specified file.

If no file is specified, human-readable results are placed into a ‘time_profiling_results.txt’ document in the current directory (’/home/docs/checkouts/readthedocs.org/user_builds/spinalcordtoolbox/checkouts/stable/documentation/source’). If the specified file is a .prof file, the file will instead be in binary format, ready for use with common post-profiler utilities (such as snakeviz).

-trace-memory

Enables memory tracing of the program.

When active, a measure of the peak memory (in KiB) will be output to the file peak_memory.txt. Optionally, developers can also modify the SCT code to add additional snapshot_memory() calls. These calls will ‘snapshot’ the memory usage at that moment, saving the memory trace at that point into a second file (memory_snapshots.txt).

By default, both outputs will be placed in the current directory (’/home/docs/checkouts/readthedocs.org/user_builds/spinalcordtoolbox/checkouts/stable/documentation/source’). Optionally, you may provide an alternative directory (-trace-memory <dir_name>), in which case all files will be placed in that directory instead. Note that this WILL incur an overhead to runtime, so it is generally advised that you do not run this in conjunction with the time profiler or in time-sensitive contexts.

-r

Possible choices: 0, 1

Remove temporary files.

Default: 1