Inspecting the results of your analysis (Quality Control, FSLeyes)
Quality Control (QC) Reports
SCT provides a web browser-based interface called a Quality Control (QC) Report. Each QC report contains a table of image entries. Clicking on an entry in the table will show a mosaic of slice images, as well as an overlay that can highlight cord segmentations, WM/GM tract volumes, and more.
How can I generate a QC report?
To generate a QC report, check to see if the command you’re using supports the -qc flag. For example:
# Basic command (no QC)
sct_propseg -i t2.nii.gz -c t2

# Command with QC flag added
sct_propseg -i t2.nii.gz -c t2 -qc ~/qc_folder
Once you specify the -qc flag, a QC report will be automatically generated in whichever folder you specified. You can specify the same folder as many times as you like.
How do I open the QC report?
At the very bottom of the terminal output for your command, instructions will be printed to help you open the QC report:
# Sample output (macOS) after running the SCT script
Use the following command to see the results in a browser:
open "qc_folder/index.html"
# Sample output (Linux) after running the SCT script
Use the following command to see the results in a browser:
xdg-open "qc_folder/index.html"
If you already have the page open, and you run new commands, you can simply refresh the page to display new QC report entries.
How do I use the QC report?
Once you run the open command, the QC report page will open up in your web browser for you to interact with.
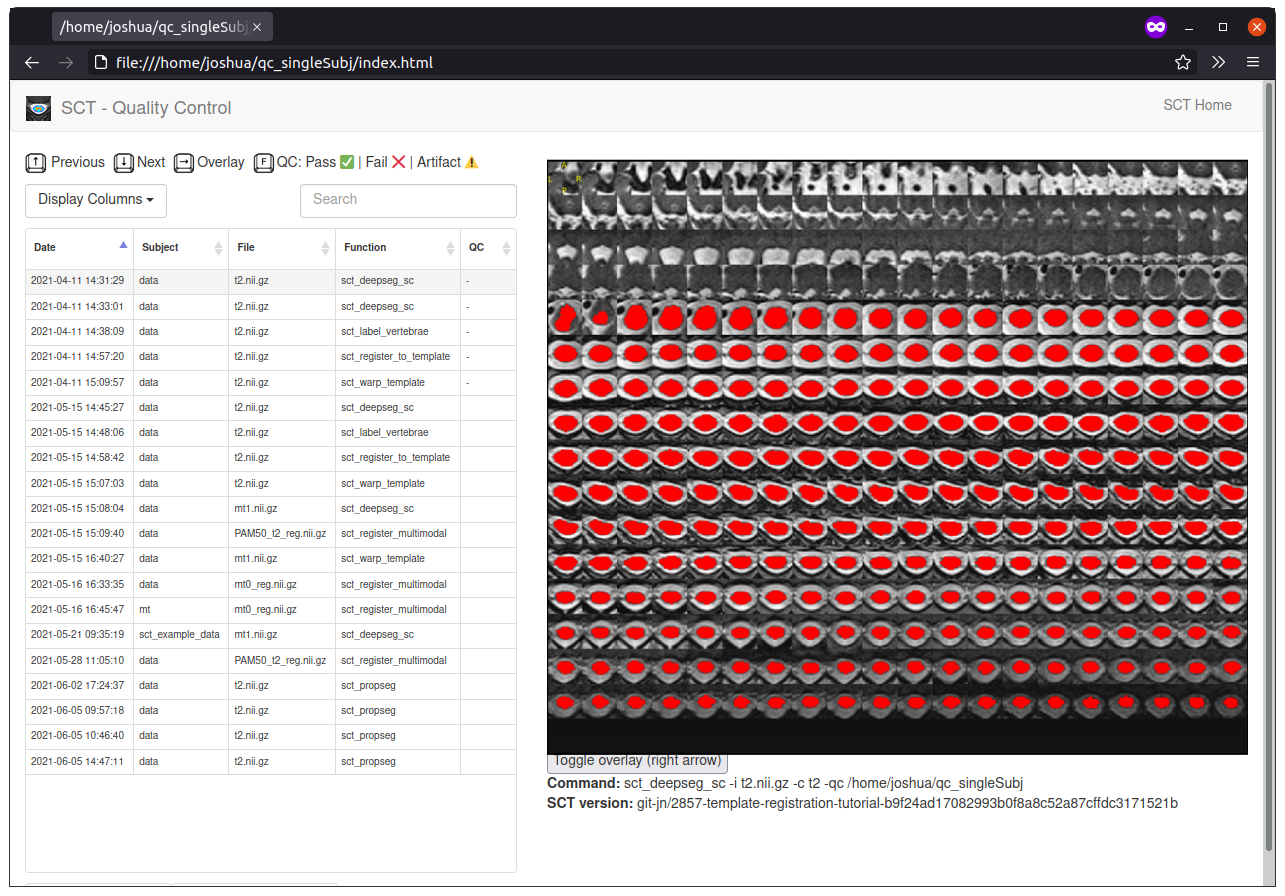
From the table on the left side, you can:
Navigate between images using the arrow keys or mouse.
Toggle the overlay using the right arrow key.
Evaluate and mark images using the
fkey. Pressing once marks the highlighted image as “Pass”, twice marks it as “Fail”, and three times marks it as “Artifact”.Export the marked images in a list format using the buttons at the bottom of the table.
This workflow is especially useful if you are performing multi-subject batch analyses, as QC reports allow you to quickly review many output files at once using your keyboard.
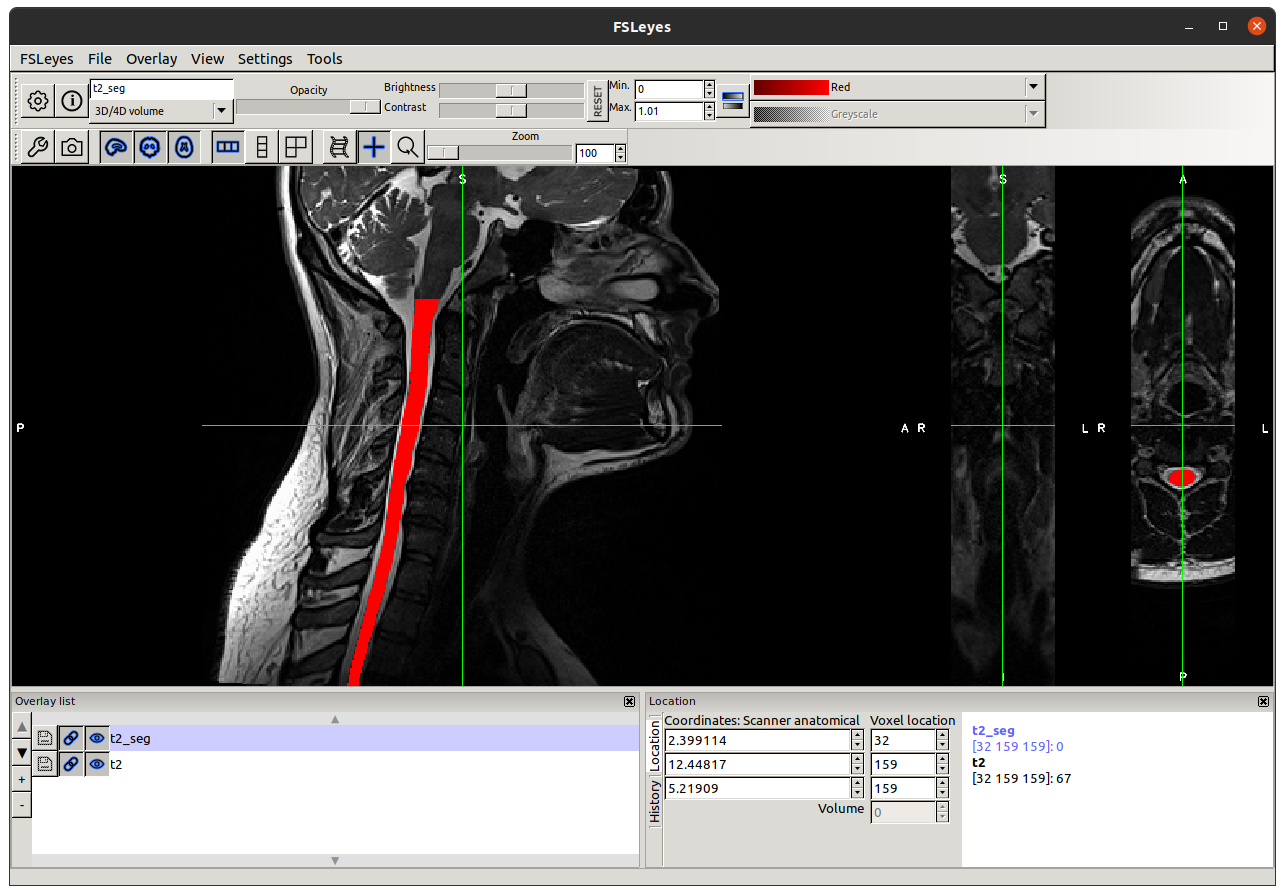
FSLeyes
If you have the FSLeyes tool installed, then some of SCT’s scripts will also print a fsleyes command as part of their output.
# Sample output after running an SCT script
Done! To view results, type:
fsleyes t2/t2.nii.gz -cm greyscale t2/t2_seg.nii.gz -cm red -a 100.0 &
Running this command will display a viewer that you can interact with. For more information about how to use FSLeyes, visit the FSLeyes documentation.